
在Linux CentOS 7上安装部署Prometheus(普罗米修斯)
1 普罗米修斯概述
Prometheus是一套开源的监控&报警&时间序列数据库的组合。适合监控Docker容器。因为Kubernetes的流行带动了Prometheus的发展
官网:https://prometheus.io/
2 时间序列数据
2.1 什么是序列数据
时间序列数据(TimeSeries Data):按照时间顺序记录系统、设备状态变化的数据被称为时序数据。
应用的场景很多:如
- 无人驾驶车辆运行中要记录的经度、纬度、速度、方向、旁边的距离等。
- 某一地区的各车辆的行驶轨迹数据
- 传统证券行业实时交易数据
- 实时运维监控数据等
2.2 时间序列数据特点
- 性能好
关系型数据库对于大规模数据的处理性能糟糕。NoSQL可以比较好的处理大规模数据,但依然比不上时间序列数据库。
- 存储成本低
高效的压缩算法,节省存储空间,有效降低IO
3 Prometheus的主要特征
- 多维度数据模型
- 灵活的查询语言
- 不依赖分布式存储,单个服务器节点是自主的
- 以HTTP方式,通过Pull模型拉取时间序列数据
- 也可以通过中间网关支持Push模型
- 通过服务发现或者静态配置,来发现目标服务对象
- 支持多种多样的图标和界面展示
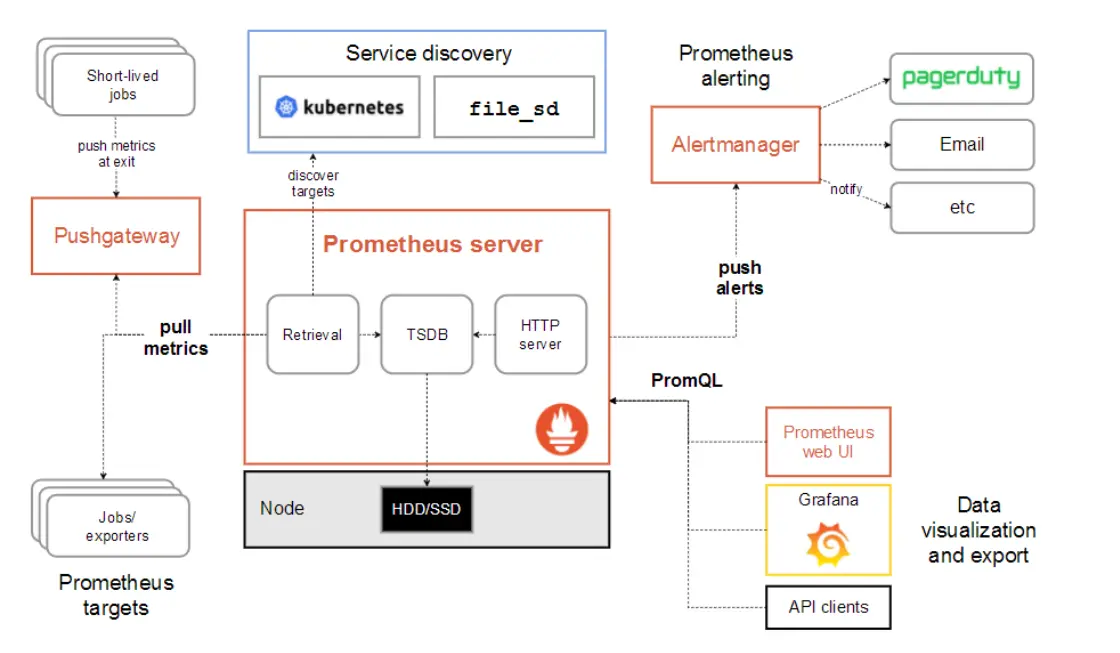
4 Prometheus原理架构图
5 实验环境准备
1
2
3
| 10.10.11.120 Prometheus 服务器
10.10.11.116 Grafana 服务器
10.10.11.113 客户端
|
关闭防火墙
1
| [root@localhost ~]# systemctl stop firewalld
|
更改主机名
1
2
3
4
5
6
7
8
9
10
11
| [root@localhost ~]# hostname prometheus
[root@localhost ~]# bash
[root@prometheus ~]#
[root@localhost ~]# hostname grafana
[root@localhost ~]# bash
[root@grafana ~]#
[root@localhost ~]# hostname client
[root@localhost ~]# bash
[root@client ~]#
|
安装Prometheus
1
2
3
4
5
6
7
8
| [root@prometheus ~]
[root@prometheus ~]
[root@prometheus ~]
[root@prometheus ~]
COMMAND PID USER FD TYPE DEVICE SIZE/OFF NODE NAME
prometheu 4673 root 3u IPv6 53174 0t0 TCP localhost:websm->localhost:44938 (ESTABLISHED)
prometheu 4673 root 9u IPv6 53169 0t0 TCP *:websm (LISTEN)
prometheu 4673 root 12u IPv4 53173 0t0 TCP localhost:44938->localhost:websm (ESTABLISHED)
|
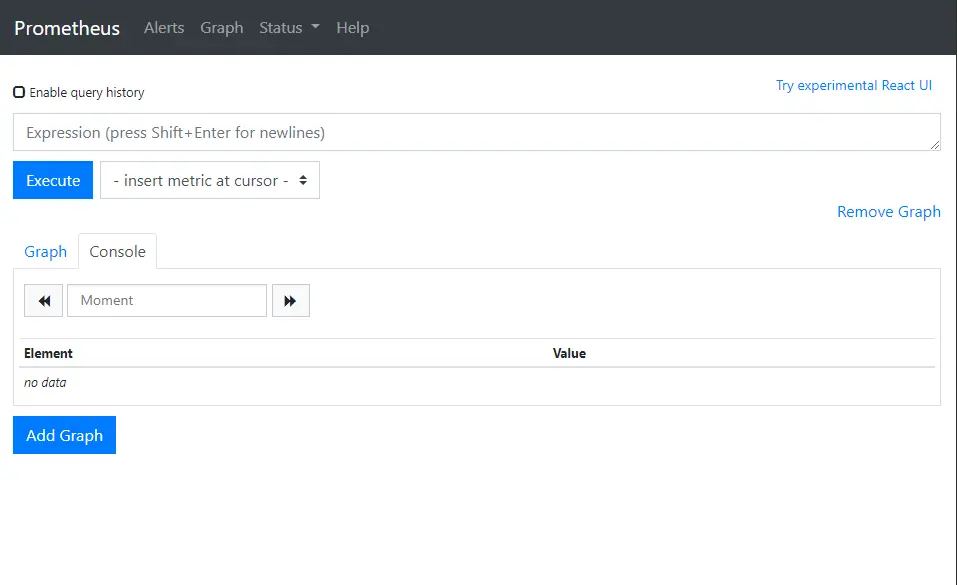
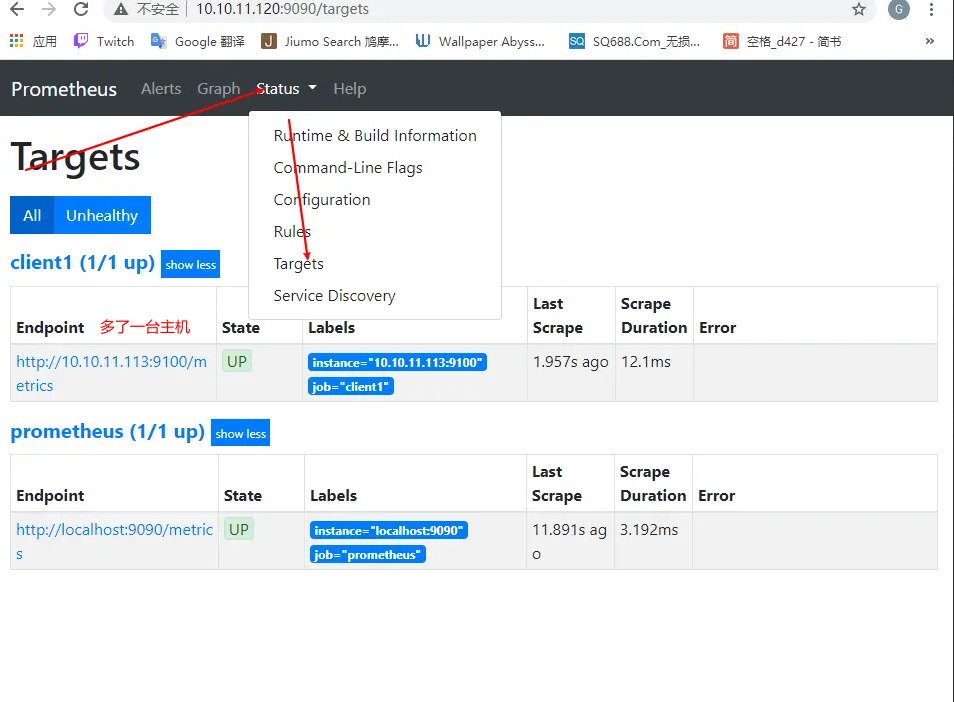
通过访问10.10.11.120:9090就可以访问到Prometheus
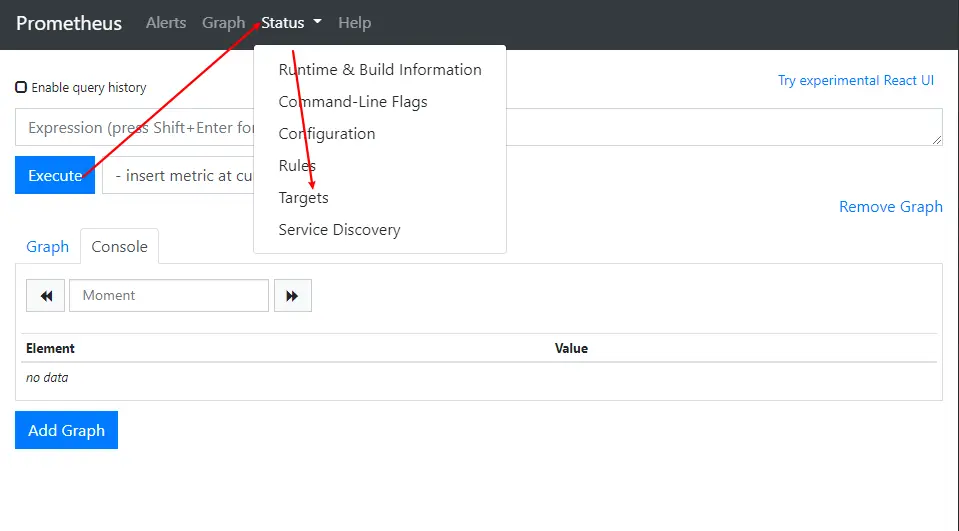
默认只监控了本机 点击Status –>Targets

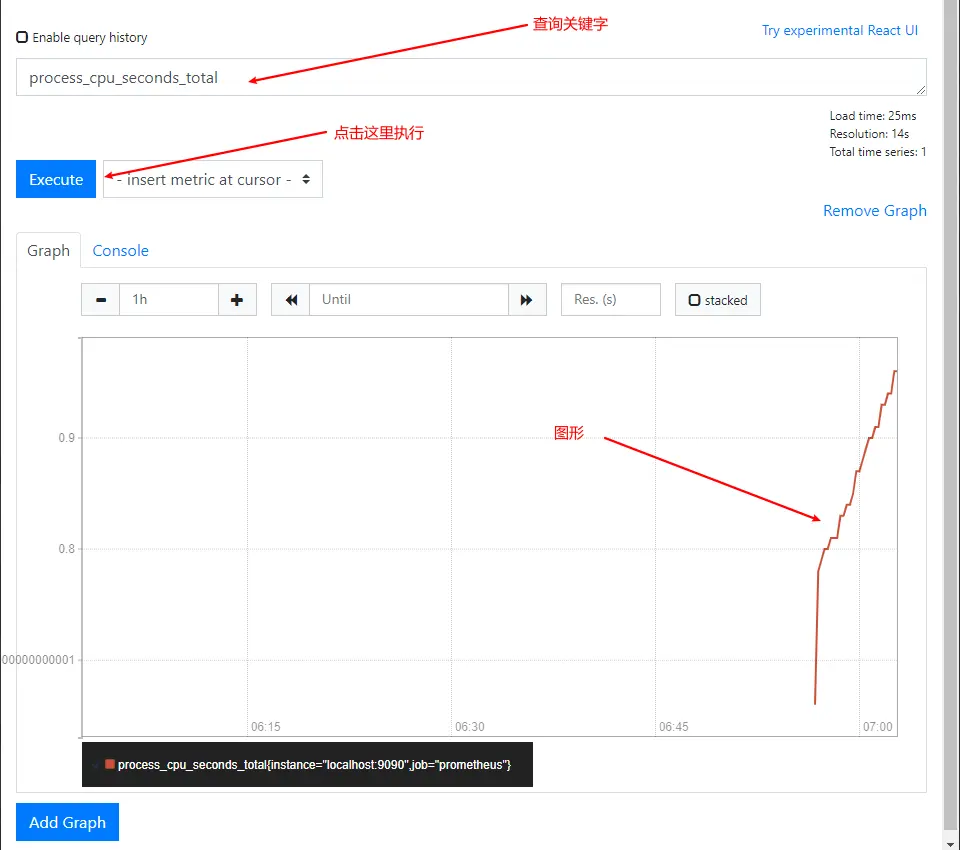
6 主机数据展示
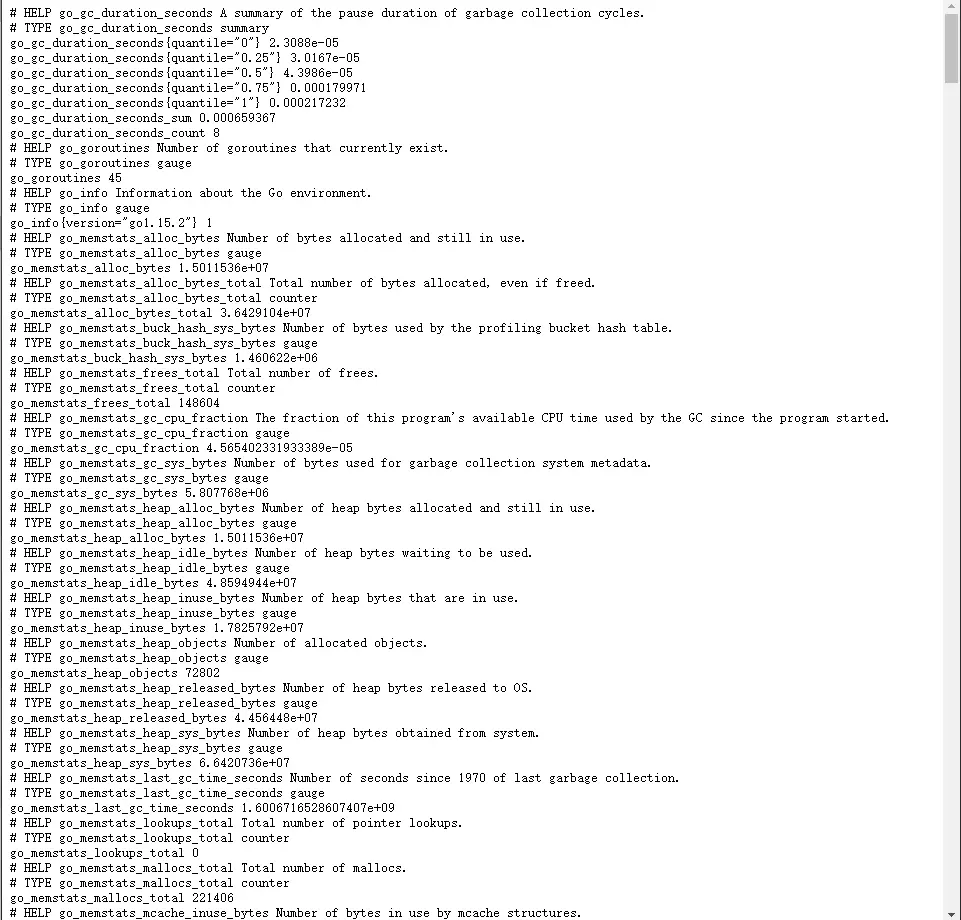
通过浏览器 http://10.10.11.120:9090/metrics 可以查看监控到的数据
在Web界面可以通过关键字查询监控项
7 配置监控
7.1 监控远程Linux主机
在远程主机安装node_exporter组件
1
2
3
4
5
6
7
8
| [root@client ~]
[root@client ~]
[root@client ~]
LICENSE node_exporter NOTICE
[root@client ~]
[root@client ~]
COMMAND PID USER FD TYPE DEVICE SIZE/OFF NODE NAME
node_expo 4579 root 3u IPv6 48879 0t0 TCP *:jetdirect (LISTEN)
|
扩展:nohup命令:如果把启动node_exporter的终端关闭,那么进程也会随之关闭。nohup会帮助你解决这个问题
通过浏览器访问10.10.11.113:9100/metrics可以查看到node_exporter在被监控端主机的监控信息
回到Prometheus服务器配置文件添加客户端的配置段
1
2
3
4
| [root@prometheus ~]# vim /usr/local/prometheus/prometheus.yml
- job_name: 'client1'
static_configs:
- targets: ['10.10.11.113:9100']
|
重启Prometheus
1
2
3
4
5
6
7
8
| [root@prometheus ~]
[root@prometheus ~]
[root@prometheus ~]
[root@prometheus ~]
COMMAND PID USER FD TYPE DEVICE SIZE/OFF NODE NAME
prometheu 57136 root 9u IPv6 113310 0t0 TCP *:websm (LISTEN)
prometheu 57136 root 10u IPv4 113315 0t0 TCP localhost:44950->localhost:websm (ESTABLISHED)
prometheu 57136 root 12u IPv6 113316 0t0 TCP localhost:websm->localhost:44950 (ESTABLISHED)
|
回到10.10.11.120:9090
点击Status –>Targets 发现多了一台主机
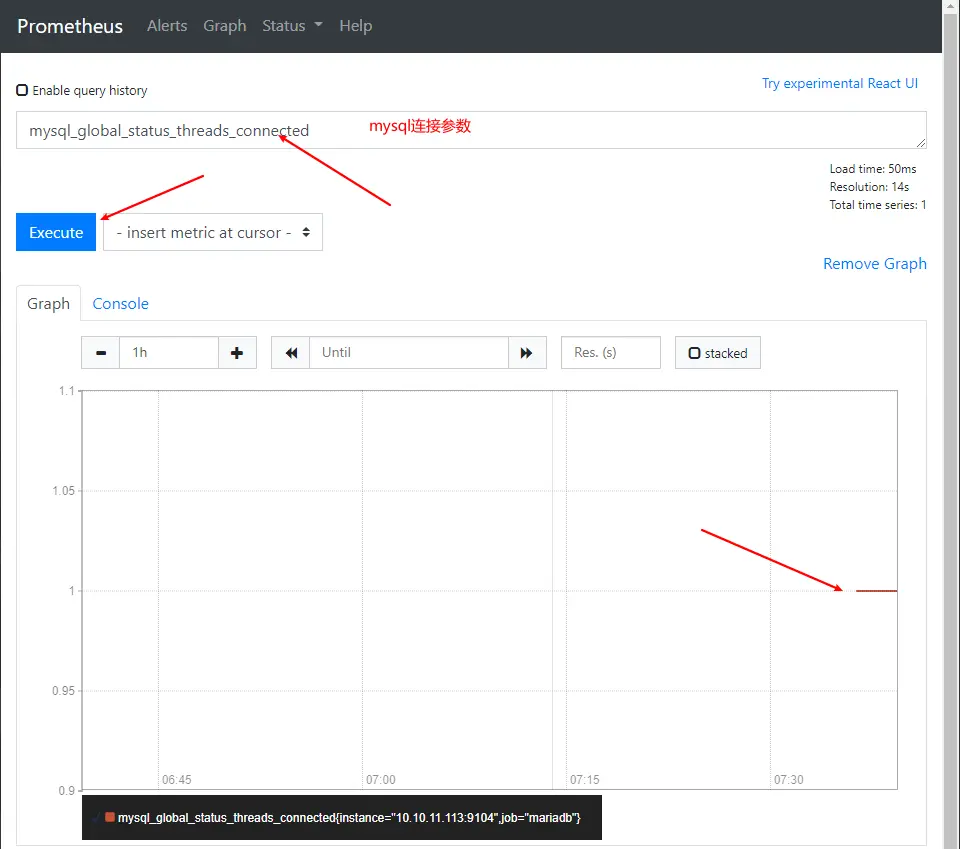
7.2 监控远程MySQL数据库
在Client上安装mysqld_exporter组件和MySQL
1
2
3
| [root@client ~]# tar -xf mysqld_exporter-0.12.1.linux-amd64.tar.gz -C /usr/local/
[root@client ~]# mv /usr/local/mysqld_exporter-0.12.1.linux-amd64/ /usr/local/mysqld_exporter
[root@client ~]# yum -y install mariadb\*
|
启动MySQL并授权
1
2
3
4
5
6
| [root@client ~]# systemctl restart mariadb
[root@client ~]# mysql -uroot
MariaDB [(none)]> grant select,replication client,process on *.* to 'mysql_monitor'@'localhost' identified by '123.com';
# 授权IP为localhost,因为不是prometheus服务器直接找mariadb获取数据,而是prometheus服务器找mysql_exporter,mysql_exporter再找mariadb。所以这个localhost是指的mysql_exporter的IP
MariaDB [(none)]> flush privileges;
Query OK, 0 rows affected (0.00 sec)
|
创建一个mariadb配置文件,写上刚刚授权的用户名和密码
1
2
3
4
5
6
7
8
| [root@client ~]# vim /usr/local/mysqld_exporter/.my.cnf
[client]
socket = /data/mysql/mysql.sock
port = 3306
user=mysql_monitor
password=123.com
|
启动mysqld_exporter
1
2
3
4
| [root@client ~]
[root@client ~]
COMMAND PID USER FD TYPE DEVICE SIZE/OFF NODE NAME
mysqld_ex 60421 root 3u IPv6 111828 0t0 TCP *:peerwire (LISTEN)
|
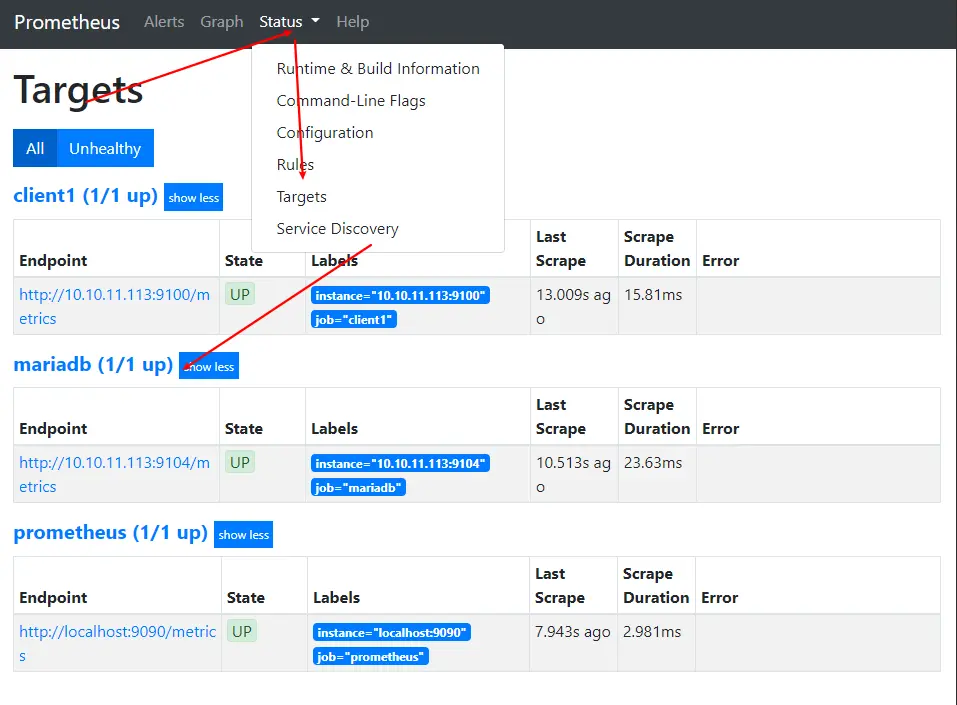
在Prometheus服务器的配置文件里添加被监控的mariadb的配置段
1
2
3
4
5
6
| [root@prometheus ~]# vim /usr/local/prometheus/prometheus.yml
- job_name: 'mariadb'
static_configs:
- targets: ['10.10.11.113:9104']
[root@prometheus ~]# pkill prometheus
[root@prometheus ~]# /usr/local/prometheus/prometheus --config.file="/usr/local/prometheus/prometheus.yml" &
|
回到web管理界面 –>点Status –>点Targets –>可以看到监控mariadb了
8 设置开机自启
创建prometheus.service配置文件,设置开机自启
8.1 prometheus
/etc/systemd/system/prometheus.service
1
2
3
4
5
6
7
8
9
10
11
12
13
|
[Unit]
Description=prometheus
After=network.target
[Service]
Type=simple
User=root
ExecStart=/usr/local/prometheus/prometheus --config.file=/usr/local/prometheus/prometheus.yml --storage.tsdb.path="/data/prometheus"
Restart=on-failure
[Install]
WantedBy=multi-user.target
|
8.2 Linux主机
/etc/systemd/system/node_exporter.service
1
2
3
4
5
6
7
8
9
10
11
12
13
14
|
[Unit]
Description=node_exporter
Documentation=https://prometheus.io/
After=network.target
[Service]
Type=simple
User=root
ExecStart=/usr/local/node_exporter/node_exporter
Restart=on-failure
[Install]
WantedBy=multi-user.target
|
8.3 MySQL数据库
/etc/systemd/system/mysqld_exporter.service
1
2
3
4
5
6
7
8
9
10
11
12
13
14
|
[Unit]
Description=mysqld_exporter
Documentation=https://prometheus.io/
After=network.target
[Service]
Type=simple
User=root
ExecStart=/usr/local/mysqld_exporter/mysqld_exporter --config.my-cnf=/usr/local/mysqld_exporter/.my.cnf
Restart=on-failure
[Install]
WantedBy=multi-user.target
|
9 Grafana连接Prometheus
在Grafana服务器上安装Grafana
1
2
3
4
5
6
7
8
| [root@grafana ~]
[root@grafana ~]
[root@grafana ~]
warning: grafana-enterprise-8.1.2-1.x86_64.rpm
[root@grafana ~]
[root@grafana ~]
COMMAND PID USER FD TYPE DEVICE SIZE/OFF NODE NAME
grafana-s 56949 grafana 8u IPv6 104827 0t0 TCP *:hbci (LISTEN)
|
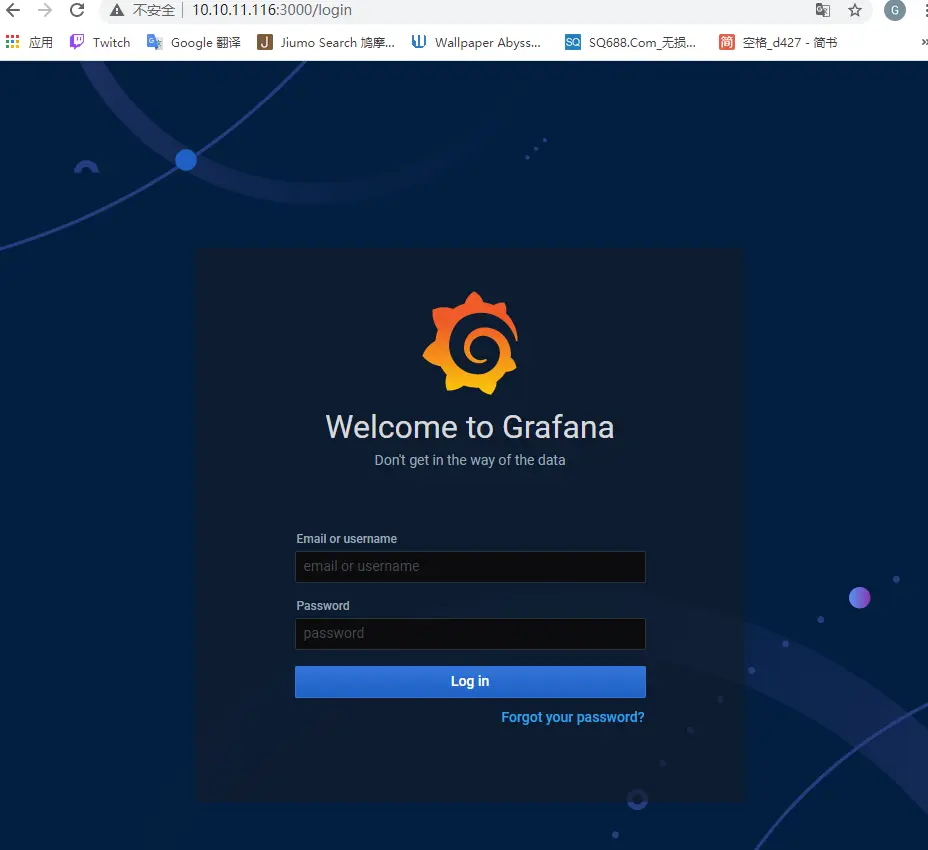
访问10.10.11.116:3000
默认admin用户,admin密码
将Prometheus服务器收集到的数据作为一个数据源添加到grafana,让grafana可以得到Prometheus的数据
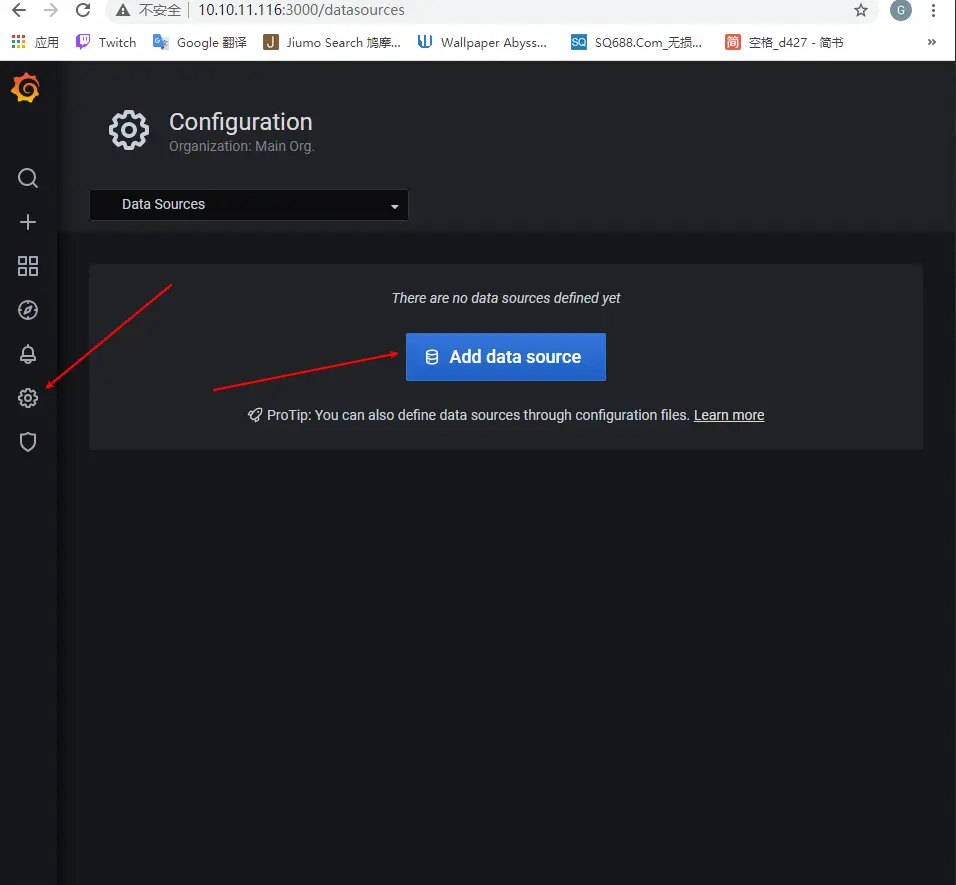
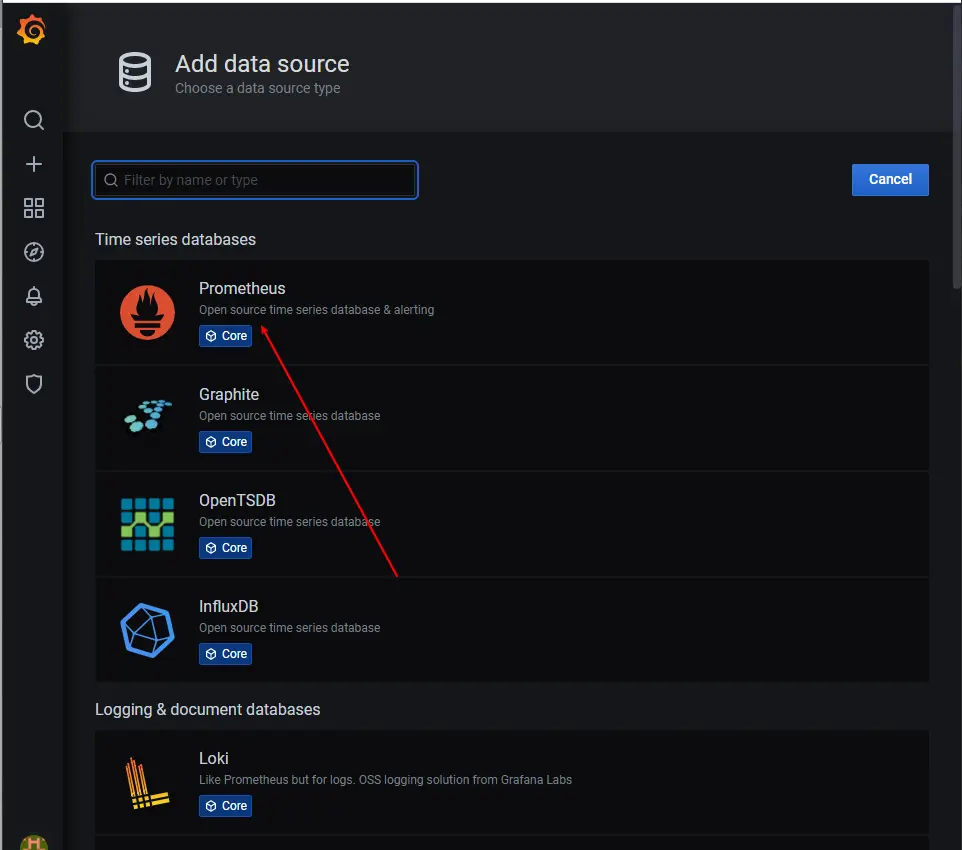
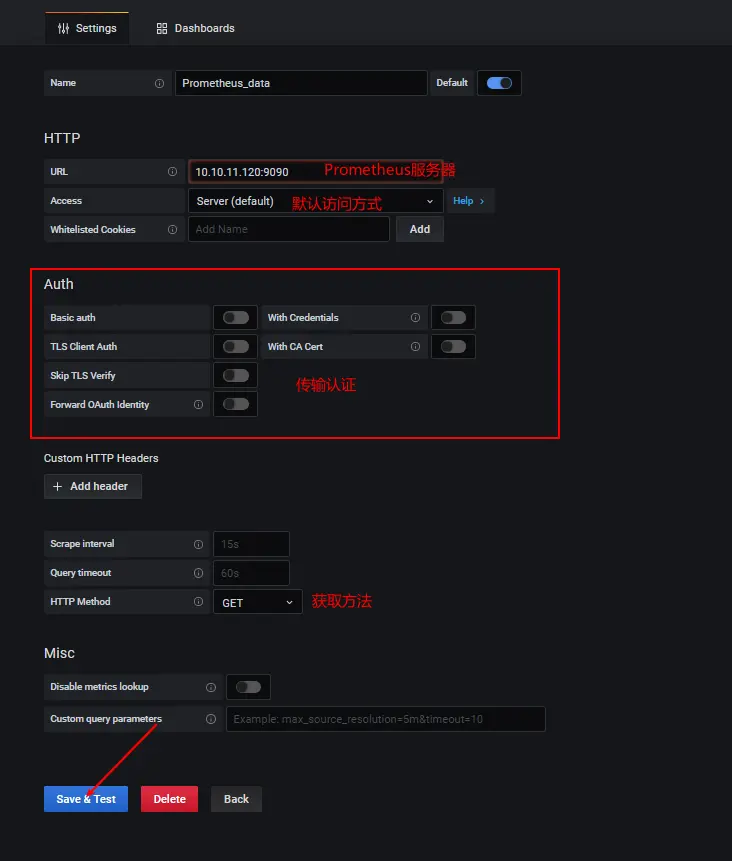
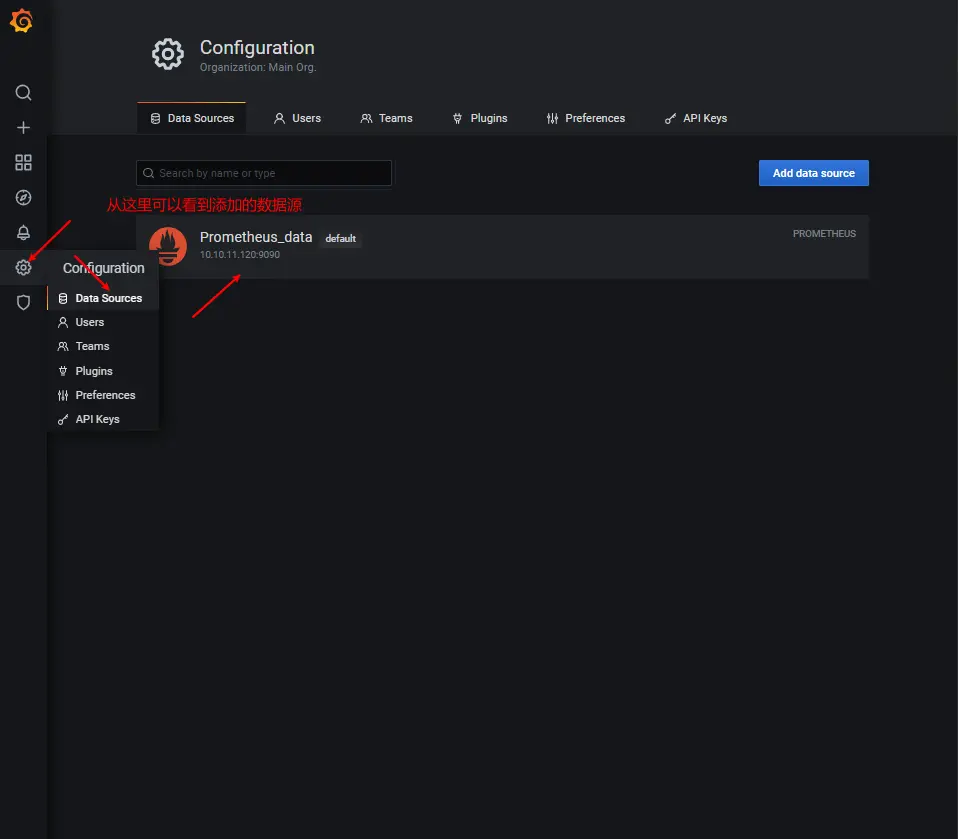
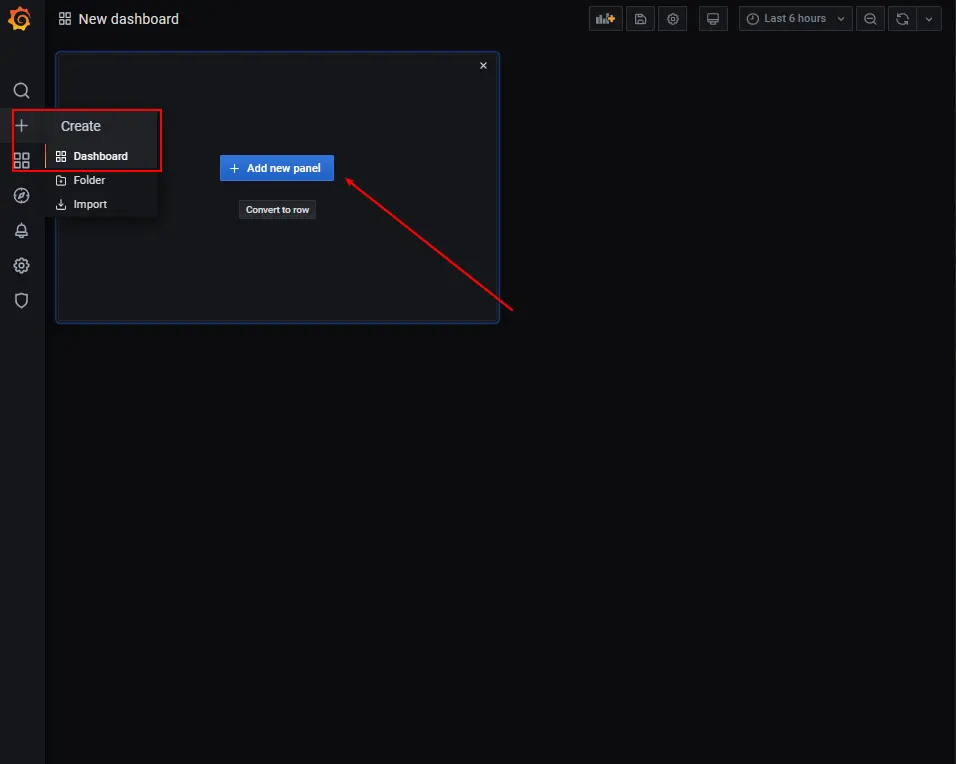
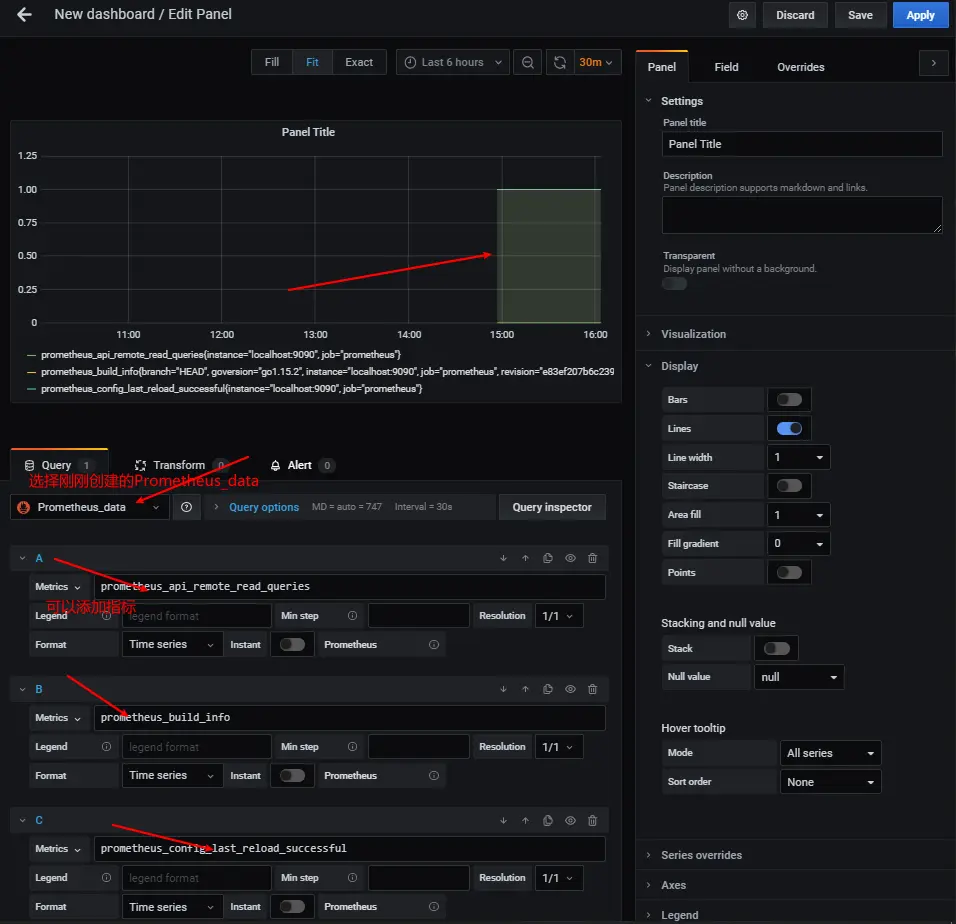
然后为添加好的数据源做图形显式

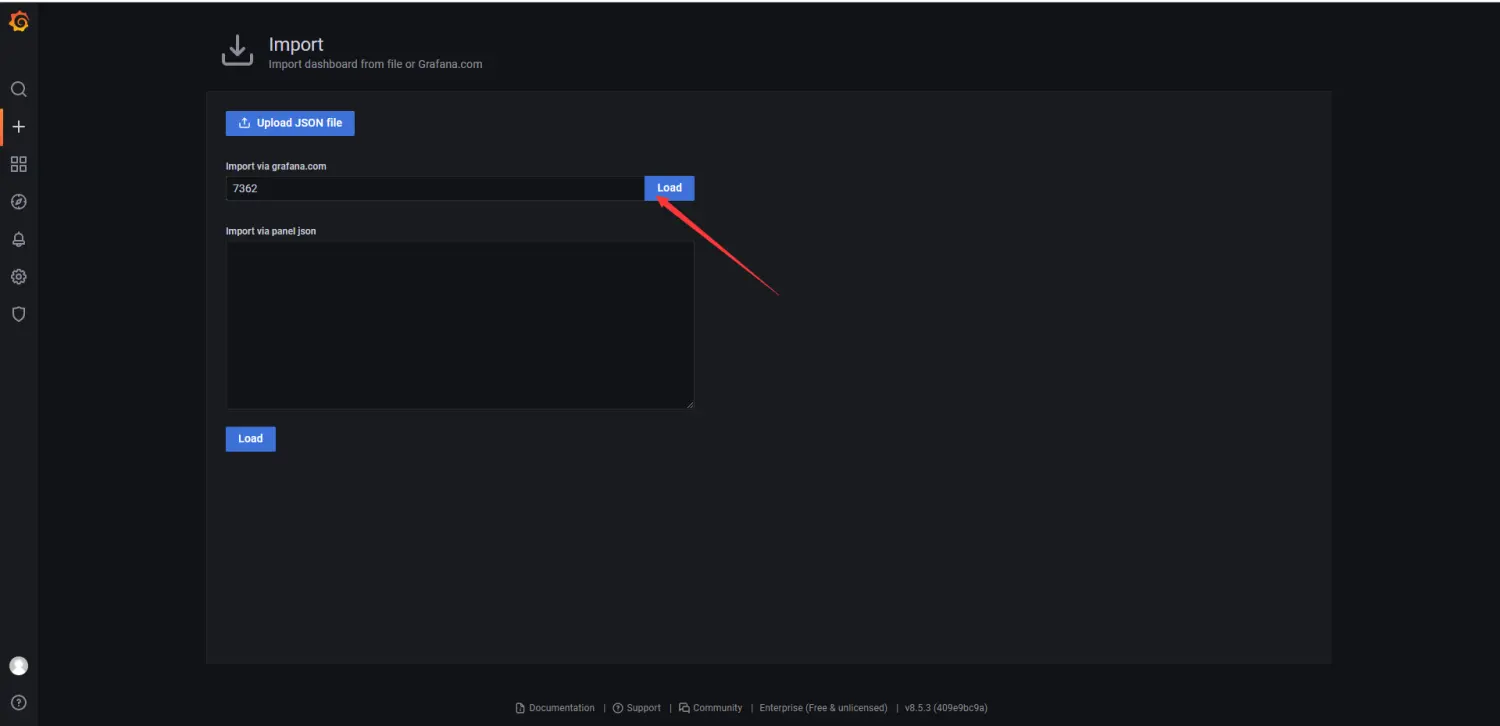
10 使用grafana官方模板来监控MySQL
官网:https://grafana.com/grafana/dashboards/
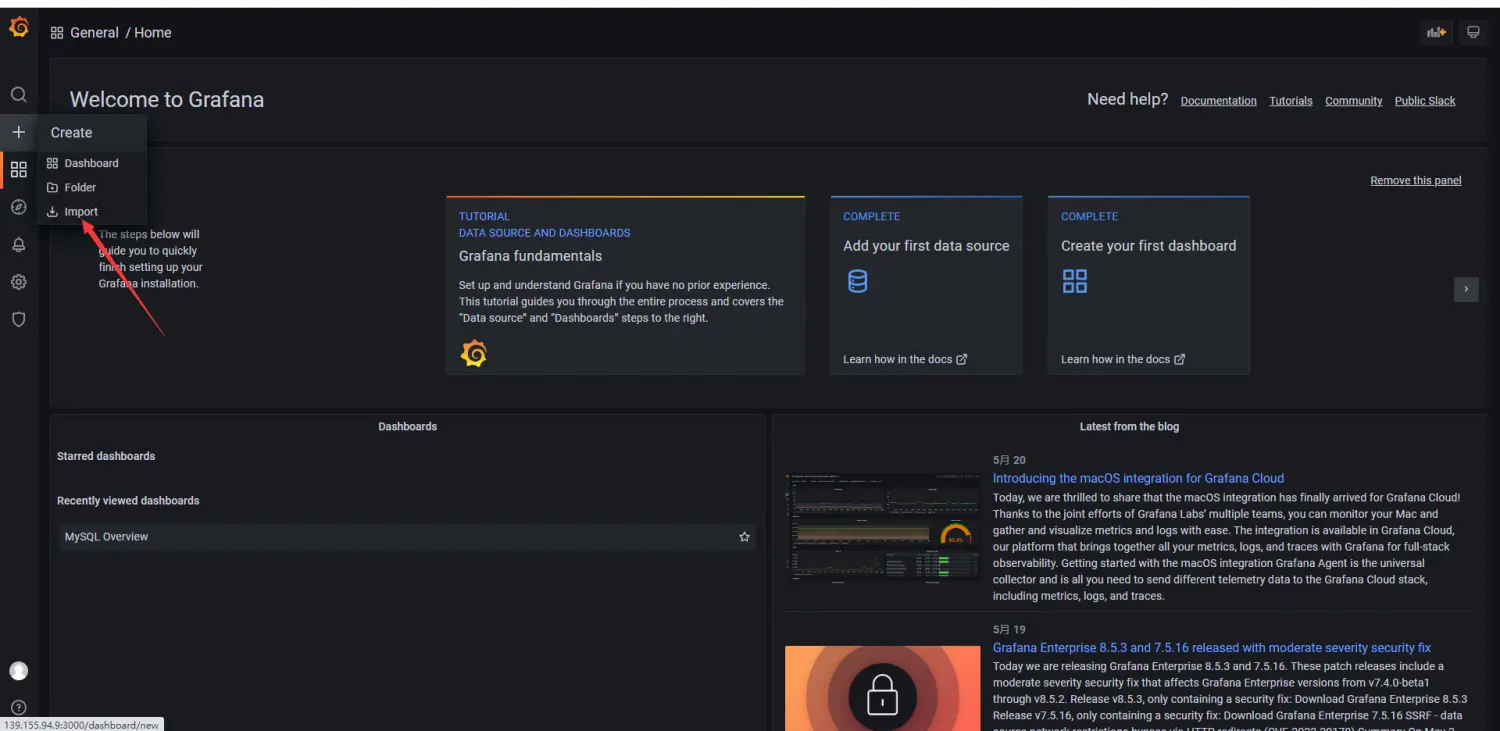
填写模板ID并加载
https://grafana.com/grafana/dashboards/7362
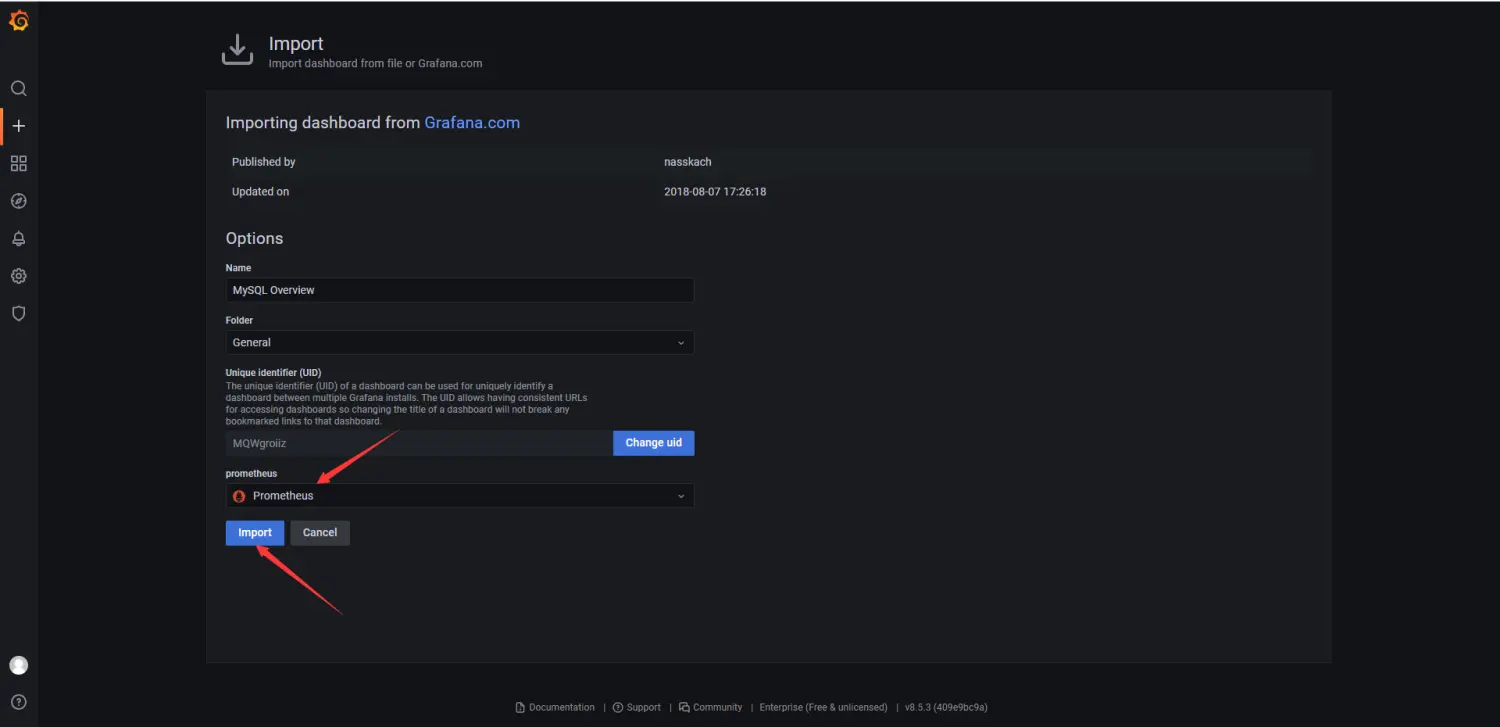
选择数据源并导入
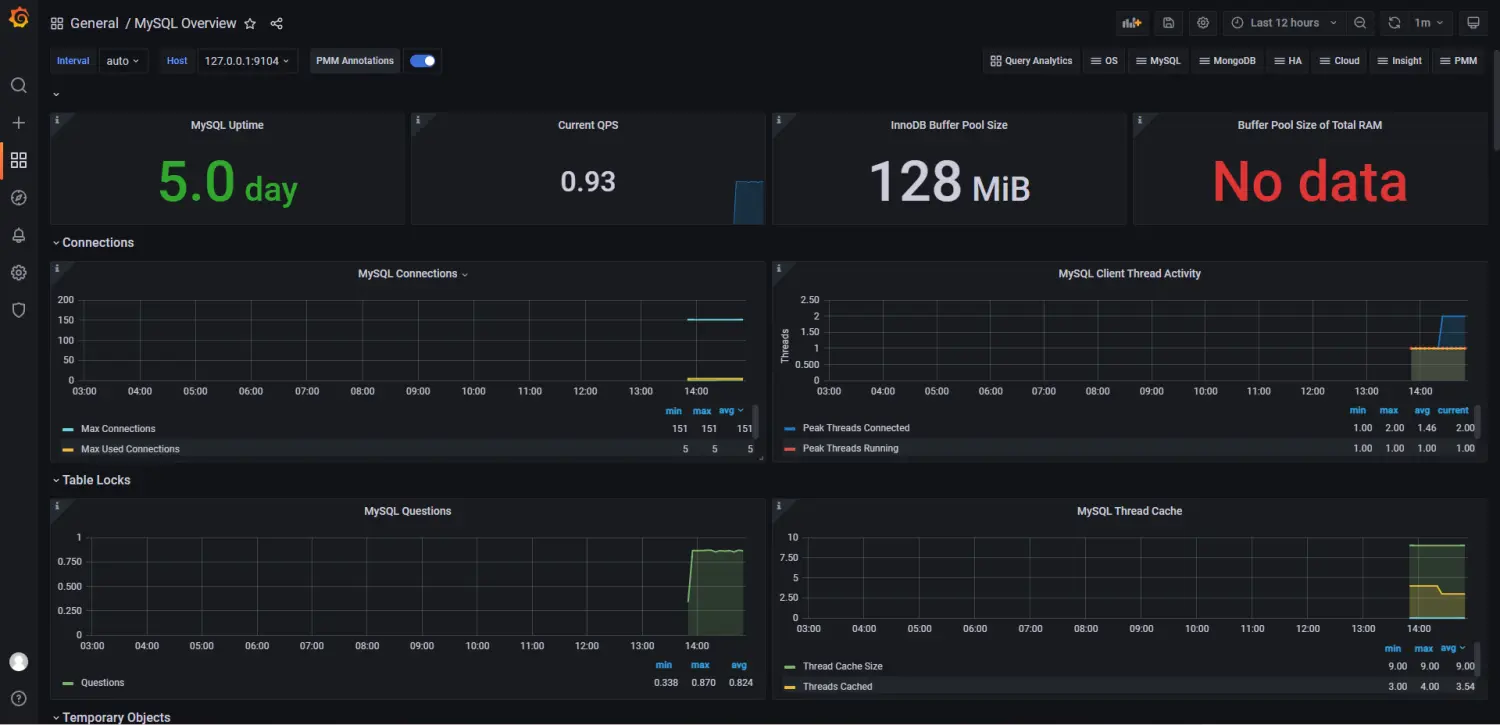
展示
作者:中门对狙
链接:https://www.jianshu.com/p/3bf80ef6ff0b
来源:简书
著作权归作者所有。商业转载请联系作者获得授权,非商业转载请注明出处。